By Anurag Jhanwar
When we talk about Equity investment, the most common adjective associated with it is of an asset class which has the potential to offer high return but involves equally High level of Risk. It is a known fact that the process of generating returns involves identification of sound company/ies which have potential to give superior profits over a sustained period of time, and which will be appreciated and rewarded through the underlying stock price movements.
However, it is easier said than done, as the journey of the company/ies is full of volatility involving periods of superior performance and periods of lull performance alike and the same might or might not be reflected in the share price movements fully, leading to deep underperformance or loss on the invested capital.
But does this approach of investment rewarding or still full of risk. Afterall we are taking exposure to an Equity Index? Normally we have heard that longterm investing rewards, but does it come at its set of inherent risk? To delve deeper and find out the return trajectory over different timeframes, Upwisery research undertook a multi-factor data analysis on the performance of NIFTY 50 by looking at monthly rolling performance for Nifty 50 for the period of 31st January,1997 till 30th September 2023 for any holding period of 1,3, 5, 7 and 10 years during this phase.
NIFTY 50 Holding Period – Return and Volatility
Nifty 50ReturnsInstancesTotal ObservationMinimumMaximumMeanPositive ReturnsNegativeReturns1-Yr-52.19%92.29%14.69%71.52%28.48%3093-Yr-13.82%56.17%12.87%91.23%8.77%2855-Yr-4.73%44.05%12.59%95.79%4.21%2617-Yr5.58%28.19%13.48%100.00%0.00%23510-Yr5.06%20.30%13.07%100.00%0.00%201
Upwisery Data Insights
As evident from the table above, historically, an investor investing for a tenure of 1-year can make a return as high as 92.3% or erode his investment by 52.2%. This tells us how volatile an investment return is when invested for a shorter duration, i.e., 1-yr against its average return of 14.7% and long-term average (10-yr) return of 13.49%. Also, for an investment tenure of 1-year, the probability of an investor making a positive return is 71.5% and a negative return of 28.5%.
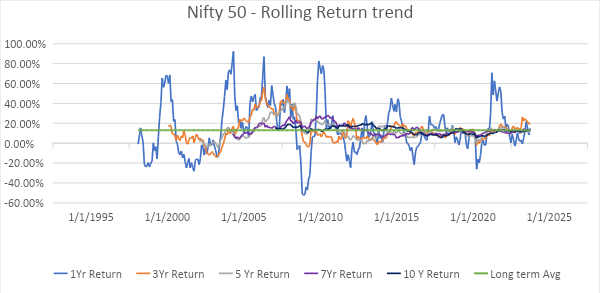
Now, if we increase the tenure of investment to 3-year, the highest and lowest returns stand at 56.17% p.a. and -13.82% p.a., respectively, and the probability of an investor making a positive return increases to 91.2%. For an investment tenure of 7 years and more, historically, all the investors have made positive returns with a maximum return of 28.2% p.a. and a minimum return of 5.6% p.a.
Overall, we can summarize the findings as below:
The instances of negative return till the holding period of 5 years, is inversely proportional to the time horizon of investment, post that the markets only provide positive returns.
The returns vary in a wide range during the short term on both positive and negative sides, the volatility keeps on getting reduced as the time horizon increases.
While passive investing can offer inflation adjusted positive returns, active style of investment on entering at dips and existing at highs can offer superior returns. As visible from the table, the high returns for different holding periods range from 20% to 92%
The notion of risk is non-existent post 5 years of holding, and the volatility tends to become more normalized and tends to reward the patience.
Over a longer period of time, volatility tends to fade away, and the stock market generally trends upwards. This means that, despite the volatility that has occurred over the years, investors who have stayed invested in the equity market over the long term have generally been rewarded.

